


Using a Simple Diagram to Illustrate Risk Management

Understanding the risks assumed in your financial life is an all-important exercise. The best crafted plan can be bamboozled by the chance auto accident, house guest injury, or the unforeseen Long Term Disability event. While there are many tools available, I have found using a simple diagram to illustrate Client insurance coverages to be an invaluable resource.
Background
The typical individual assesses risk management mostly through inertia – I have had car insurance for forever, I need to have car insurance, I am going to renew my auto insurance policy. In some cases, like auto insurance, this methodology is sufficient. In other situations - particularly when the same individual is in unfamiliar territory - this same methodology can be disastrous. A prime example is leaving a job where Long Term Disability coverage is provided to start your own business, thus foregoing Long Term Disability coverage.
While listing out and perhaps discussing the various insurance coverages may be of some assistance, mapping them out on a diagram is, in my view, a bit more exact while also providing a visual cue of areas requiring more attention.
The Inputs
As with any system, the product is only as good as the inputs. To get started with constructing the Insurance Coverages Diagram, the following is a basic list of required documents, which is of course customizable to any individual or family:
- Life Insurance Policies
- Pension Information
- Employer-Provided Benefits
- Annuity Information
- Homeowner's Insurance Policy
- Long-Term Care Insurance Policy
- Auto Insurance Policy
- Umbrella Insurance Policy
- Other Insurance Information as required
The various data points for each items are desired - coverage period, premium, beneficiary, etc.
Constructing the Diagram
A) The Basic Information
We start with inputting the Clients' Basic Information:
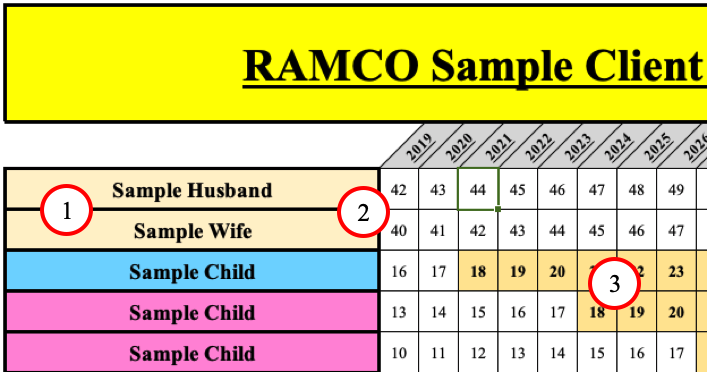
- Names. Names on the life - color coded for the children
- Ages. Ages (as of December 31st of the given year
- Important Dates. Highlight the 'projected' dates when children would transition from High School
B) Input Insurance Coverages
Using the data provided by the Client, we input the insurance and other coverage data into the chart:
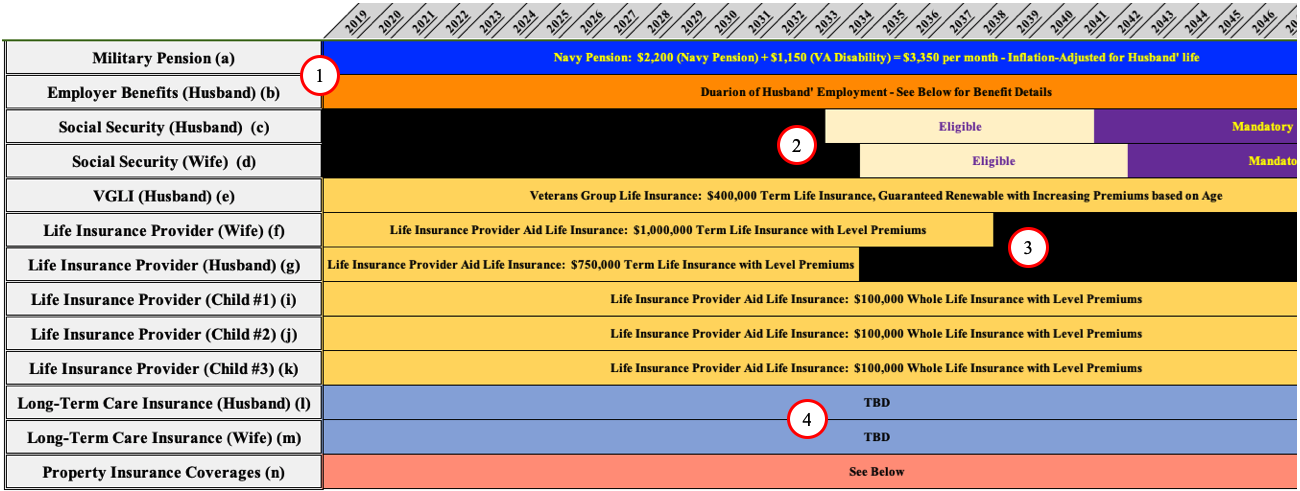
- Pension and Social Security. Enter in the coverages and amounts, noting anything unique.
- Social Security. Note the ages when claiming is optional and then mandatory.
- Life Insurance. Make sure to note the end dates of Term Life Insurance Coverage.
- Recommended Coverages. For Insurance Coverages we recommend considering, we make an entry with 'TBD' indicating an insurance application may be forthcoming.
C) Enter Specific Coverage Information
For each coverage in the diagram, we list the salient data points related to the coverage:
-
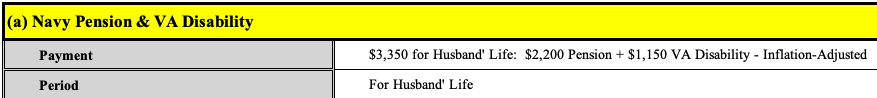
Military Pension. Enter the relevant data, noting if there is Survivor Benefit Plan coverage.
-
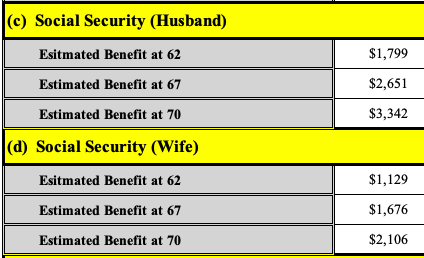
Social Security. Input the early, on-time, and late claiming monthly payments.
-
Employer Benefits. List each individually - these may be highly customized.
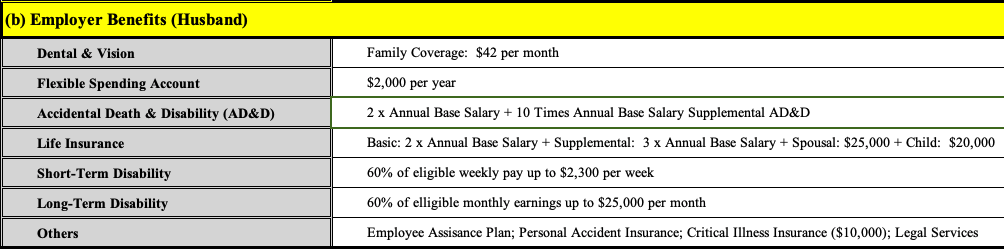
-
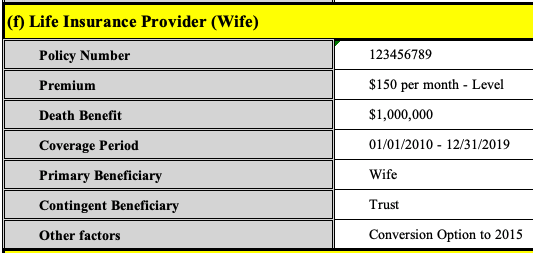
Life Insurance Information. It is essential to know all the details related to each policy.
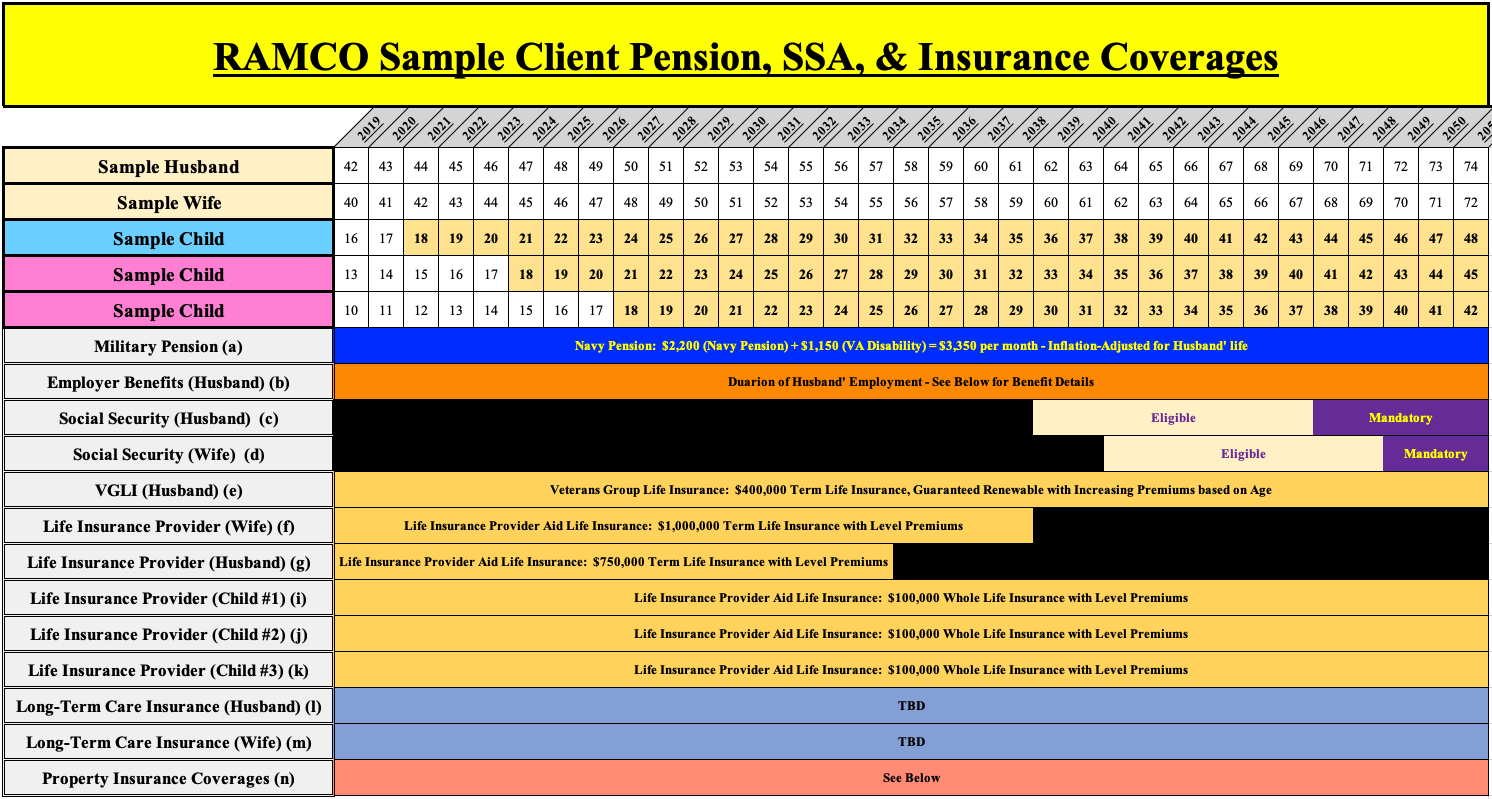
D) Putting It All Together
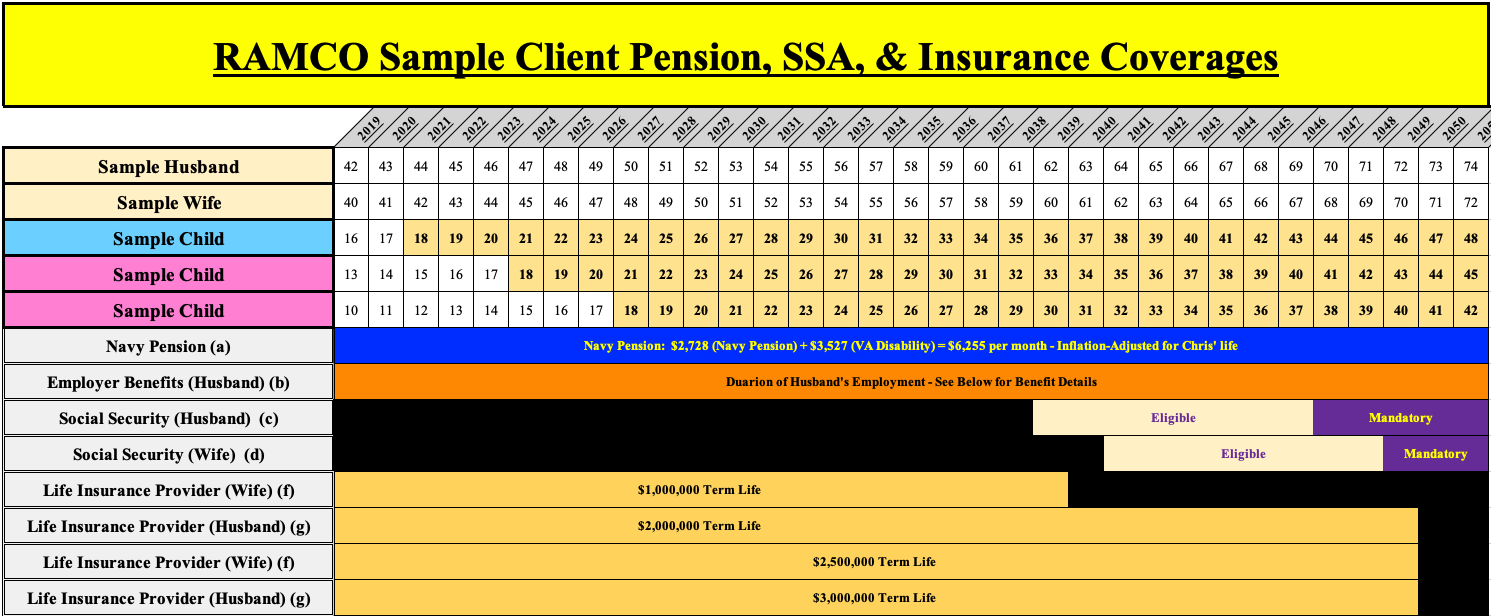
Once we have completed the diagram, we forward it to the Client for review. Here is what it looks like (lower amplifying information omitted):
Analyzing the Diagram
The Right Amount and Duration of Life Insurance Coverage
How much insurance anyone or any couple may collectively need is indeed unique. Everyone's circumstances are different – Do you have a pension? How is your health? How reliant is your family on each respective income? The list goes on and on. We spend a good bit of time investigating this number.
The other part of the life insurance discussion is duration of the coverage. This is where the diagram can be of tremendous assistance. Consider the following diagram:
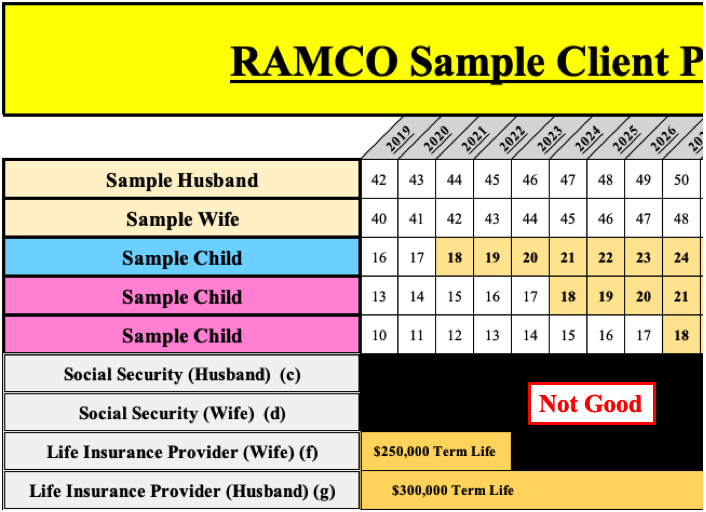
A few points to note:
- Neither the husband nor the wife are at Social Security claiming age.
- Life insurance coverage is only $250,000 on the wife's life.
- The wife's coverage terminates in 4 years.
- Life insurance coverage is only $300,000 on the husband's life.
- At least one child will be at home for the next 8 years.
For these particular Clients, we would likely re-visit the amount of coverage needed, which likely exceeds the current coverage. Moreover, we would consider a longer duration of coverage since younger children generally mean lower net worth for the parents and more reliance on earned income. Thus, a greater amount of insurance coverage may be recommended.
Having Too Much Coverage
In this case, we would note the following:
- Large amounts of coverage for the Husband & Wife
- Long duration coverage, which is generally more expensive
- Coverage for periods well beyond when young children are at home
- Coverage into periods where Net Worth is generally at its maximum
This amount of coverage may be valid, particularly if there is a need to fund something like a Buy/Sell Agreement for a business. However, we would definitely want to look a good bit closer at this amount of coverage and see if it is appropriate for the unique circumstances of the Client couple.
Commonly Overlooked Areas
Umbrella Insurance. Commonly referred to as Excess Liability Coverage, Umbrella Protection provides coverage for liabilities in excess of an existing policy, such as Homeowner's and/or Auto Coverage. With few exceptions, we generally recommend investigating Umbrella Insurance further, especially if teen-aged drivers are on the road.
Long Term Disability Insurance. At all ages, the risk of becoming disabled exceeds the risk of dying. Therefore, it makes sense to give at least a cursory glance toward Disability Insurance. For some employees, this is an employer-provided benefit. For others, seeking coverage in the insurance market is the only option. Whatever the case, we document what the Client chooses regarding Disability Insurance.
Conclusion
While not a panacea, the diagram explained above is an excellent tool for validating an overall risk posture. Of course, the various insurance policies are the governing documents; however, sometimes having a picture can assist with grasping the nuances involved with risk management.
At the end of the day, we want to “lay off” catastrophic risk to an insurance company and mitigate those risks we assume to the maximum extent practical.
Comments, criticism, and suggestions are always welcome. If you would like to provide any, please contact me here.